
Frequency Response vs. Frequency Range: How Are They Different?

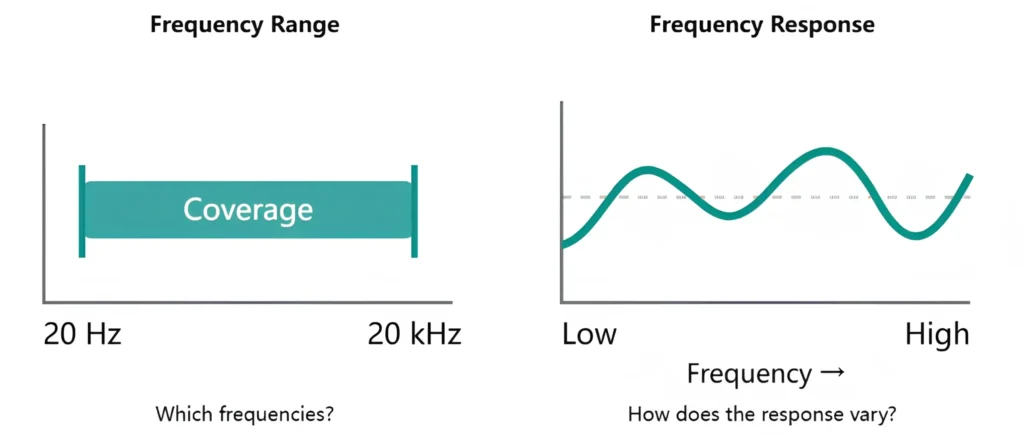
Spec sheets throw “frequency response” and “frequency range” around as if they mean the same thing. But they answer two different questions. Frequency range tells you how low and how high a device can go. Frequency response tells you what happens to every frequency in between: which ones get boosted, which ones get cut, and which ones pass through untouched.
In this guide, we’ll break down frequency response vs. frequency range, explain what 20 Hz–20 kHz actually means, and show you how to read a frequency response graph so you can shop with more confidence.
What Is Frequency Range?
Frequency range is the span between the lowest and highest frequencies a device can capture or reproduce. It’s usually described as two numbers. The fifine AmpliGame AM8 dynamic mic, for example, lists 50 Hz–16 kHz, while the Audio-Technica ATH-M50x headphones list 15 Hz–28 kHz.
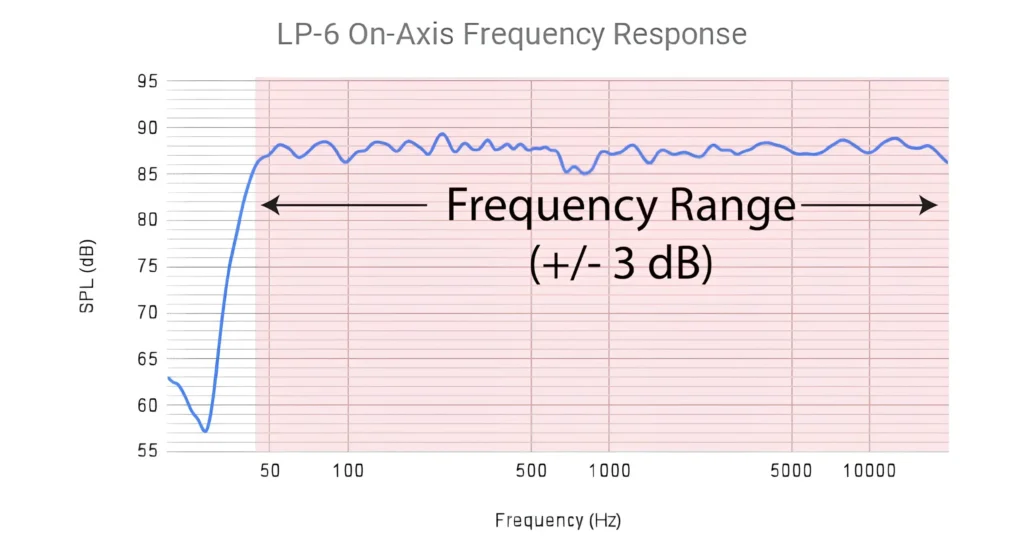
Think of it as the width of a road: it shows the edges, not how smooth the ride is.
Coverage still matters, because almost no sound is a single frequency. Middle C on a piano has a fundamental of about 261.6 Hz, plus quieter harmonics at 523.2 Hz, 784.8 Hz and higher. Cut off the harmonics and instruments lose their character.
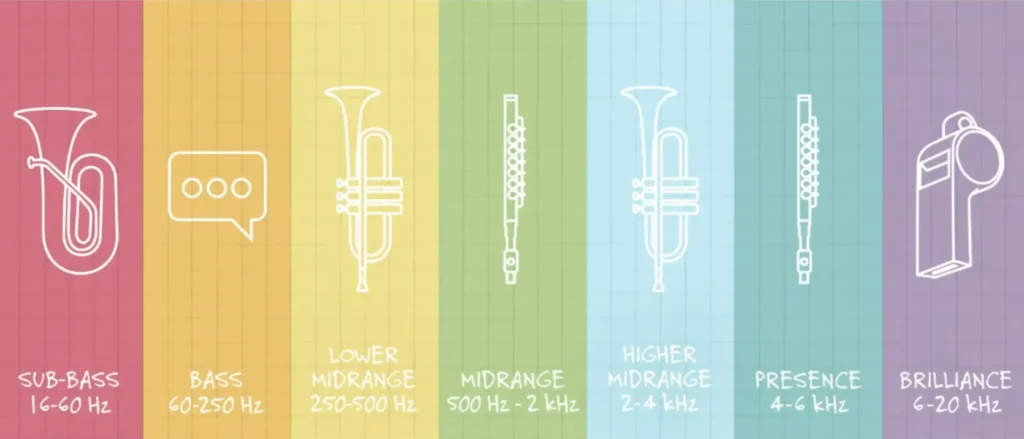
Audio engineers often split the audible spectrum into seven bands:
| Band | Approx. range | What lives there |
|---|---|---|
| Sub-bass | 20–60 Hz | Deep bass and kick drum you feel more than hear |
| Bass | 60–250 Hz | Rhythm-section weight; the fundamentals of the speaking voice |
| Low mids | 250–500 Hz | Most instruments overlap; too much sounds muddy |
| Midrange | 500 Hz–2 kHz | Too much at 500 Hz–1 kHz sounds honky and telephone-like |
| High mids | 2–4 kHz | Vocal prominence and drum attack; too much sounds harsh |
| Presence | 4–6 kHz | Clarity and definition; a boost makes sounds feel closer |
| Brilliance | 6–20 kHz | Air, cymbal sizzle and sibilance |
What Does 20 Hz–20 kHz Mean?
Hertz (Hz) measures cycles per second. A 20 Hz tone vibrates 20 times per second: a deep rumble. A kilohertz (kHz) is 1,000 Hz, so 20 kHz means 20,000 cycles per second: a thin, high-pitched whine.
The 20 Hz–20 kHz range is the classic estimate of human hearing, which is why spec sheets love it. But it’s an approximation. Most hear less, and the top end goes first: a 2001 study in Occupational Medicine tested hearing between 10 and 18 kHz and found that age, more than noise exposure, was the main predictor of how much high-frequency hearing people had lost.
Does a Wider Frequency Range Mean Better Sound Quality?
Not on its own. Here’s why:
- Range says nothing about balance. Headphones can cover 20 Hz–20 kHz and still have a big dip in the mids that makes vocals sound hollow.
- The endpoints need a tolerance. Sennheiser lists its HD 600 headphones at 12 Hz–40.5 kHz, but the spec page gives no dB tolerance. Is output at 12 Hz nearly full strength or barely there? The numbers alone can’t tell you.
- Extension past 20 kHz is mostly bragging rights. Both the HD 600 and ATH-M50x claim highs well above what most adults can hear.
- The job matters more than the width. For clear speech, even one tiny speaker with a narrow range can do an excellent job.
What Is Frequency Response?
Frequency response describes how a device handles different frequencies by comparing the input balance with the output balance.
To measure it, engineers feed in a test signal with every audible frequency at the same level and measure the output. Headphones get a constant electrical input; microphones get a constant sound source.
If output matches input exactly, the response is flat. Real devices almost always boost some frequencies and cut others.
How to Read a Frequency Response Graph
A frequency response graph has three parts:
- The horizontal axis shows frequency, usually 20 Hz on the left to 20 kHz on the right. The scale is logarithmic, so 20–200 Hz takes the same space as 2–20 kHz.
- The vertical axis shows relative level in decibels (dB), also a logarithmic unit.
- The line is the device’s response. Where it rises, the device is louder at that frequency. Where it falls, it’s quieter.
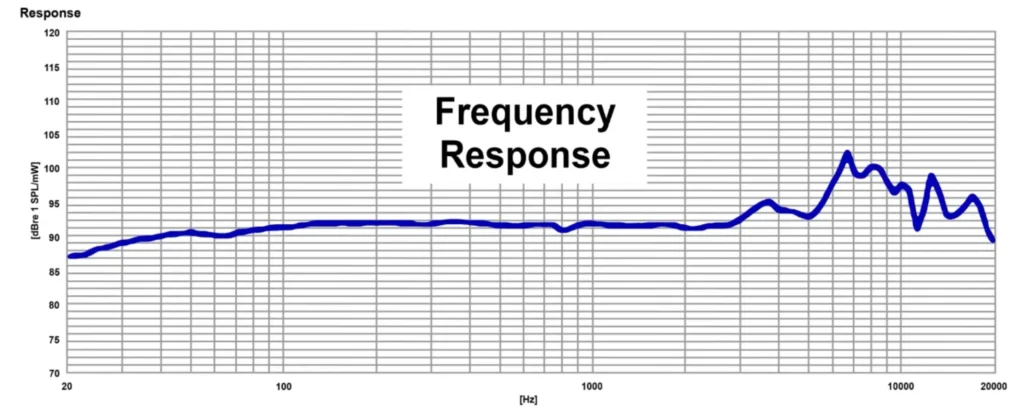
For example, a 77 mm speaker might barely produce anything below 100 Hz, peak just under 300 Hz (its resonant frequency) and stay fairly even from 500 Hz to 20 kHz.
On any graph, check where the line falls off at each end and where the biggest peaks and dips land.
What Do Peaks, Dips and a Flat Response Mean?
A flat response adds little coloration. That’s ideal for studio monitors and mixing headphones, so you judge your recording, not your gear.
Peaks are boosts. A bass peak adds weight or boom. A peak around 2–4 kHz can sound harsh and tiring. A 4–6 kHz lift adds clarity and pulls a voice forward. Above 6 kHz, a boost adds sparkle but can exaggerate sibilance, which sits roughly between 5 and 14 kHz depending on the voice.
Dips are cuts. Too little low-mid energy sounds thin. A presence dip makes sound feel distant.
Flat isn’t always the goal. The Shure Beta 52A kick drum mic adds a presence peak at 4 kHz to help the kick stand out in a mix, and a vocal mic with a subtle high-mid boost can help a singer cut through a loud band.
Frequency Response vs. Frequency Range: Key Differences
Both specs come from the same measurement. The difference is how much of that measurement you get to see. A frequency range shrinks the whole curve down to two endpoints. A frequency response keeps the shape.
A Side-by-Side Comparison
| Frequency range | Frequency response | |
|---|---|---|
| Definition | The lowest and highest frequencies a device can capture or reproduce | How a device’s output level changes across those frequencies |
| Question it answers | How low and how high can it go? | How even is it, and where does it boost or cut? |
| Typical spec | 50 Hz–16 kHz (fifine AmpliGame AM8) | 45 Hz–21 kHz ±3 dB (Kali LP-6 V2), or a full curve |
| How it’s presented | Two numbers, often with no tolerance | A graph with frequency on the x-axis and dB on the y-axis |
| What it tells you | Coverage of the audible spectrum | Tonal balance, coloration and likely sound signature |
| What it misses | Peaks, dips and overall tone | Real-world factors like placement, fit and room |
| Best used for | A quick filter when shortlisting | Comparing sound and matching gear to a job |
Frequency Range: Which Frequencies Are Covered
Frequency range answers how far the device reaches. That makes it a useful first filter.
If you’re miking a kick drum, you need low-end reach, which is why the Shure Beta 52A goes down to 20 Hz. Its range tops out at 10 kHz, but that’s fine: a kick drum doesn’t need much up there.
For voice, the bar is lower than most people expect. The Shure SM58, one of the most widely used vocal mics, lists 50 Hz–15 kHz. The fifine AM8 microphone lists a similar 50 Hz–16 kHz. Neither stretches to the full 20 Hz–20 kHz, and neither needs to for speech, streaming or live vocals.
However, frequency range doesn’t tell you how a device sounds inside those limits. That’s why two mics with identical endpoints can sound different.
Frequency Response: How a Device Handles Those Frequencies
Frequency response answers what the device does to the sound between those endpoints.
Take the Shure SM58 again. The 50 Hz–15 kHz frequency range sounds generic. For the frequency response of the Shure SM58, the midrange is bright, and the bass has a gradual rolloff. As a cardioid mic used about 6 mm (1/4 inch) from the source boosts bass by 6 to 10 dB below 100 Hz, the SM58’s curve tames that, so close-up vocals stay clear instead of boomy.
Even though the frequency range never changes, the built-in switches in the Shure SM78 let you add a bass rolloff or a presence boost. The range never changes. The response does, and so does the sound.
Tolerance: Where Range Meets Response
Frequency tolerance links the two specs. It tells you how far the level can drift from even before the manufacturer stops counting a frequency as “covered.”
Kali Audio’s LP-6 V2 studio monitor is a useful case because Kali publishes both numbers:
| Kali LP-6 V2 spec | Figure | What it means |
|---|---|---|
| Frequency range (±3 dB) | 45 Hz–21 kHz | Output stays roughly even across this span |
| Frequency response (-10 dB) | 39 Hz–25 kHz | The usable limit before output drops off sharply |
Same speaker, two very different pairs of numbers, and the only thing that changed is the tolerance. Kali points out that below 39 Hz the LP-6 barely responds at all; feed it 30 Hz, and you get almost nothing.
Notice the labels, too. Kali calls the ±3 dB figure “range” and the -10 dB figure “response.” Many other brands put a bare pair of numbers under “frequency response.” So, two numbers with no tolerance only tell you about coverage. A curve, or numbers with a ±dB tolerance, tell you about response.
How Do These Specs Affect Microphones and Headphones?
Frequency Response vs. Frequency Range in Microphones
A microphone converts sound into an electrical signal, so its response shows how faithfully it captures your voice. Mics tend to measure flatter and wider than speakers, but their charts come with fine print.
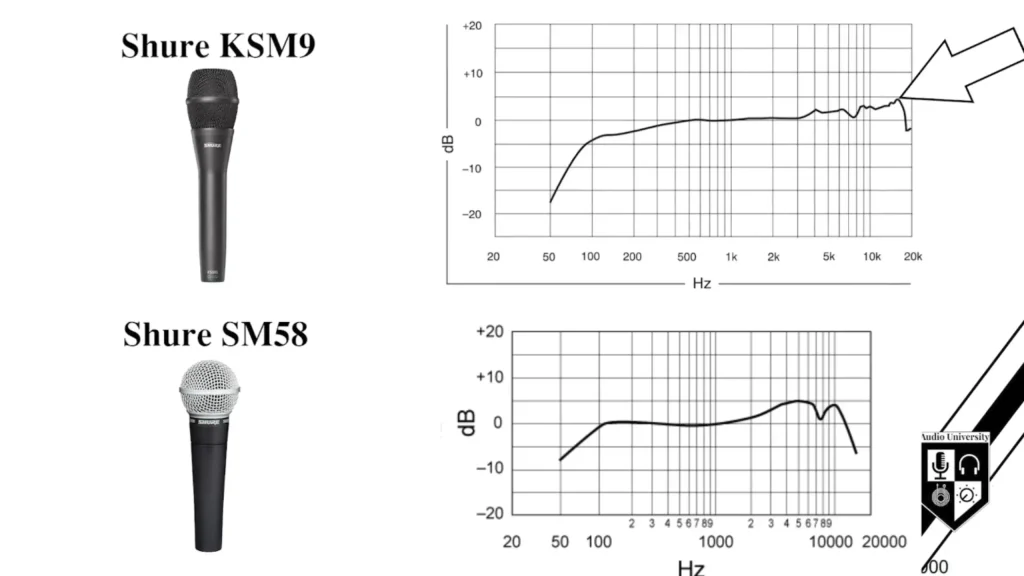
A microphone frequency response chart usually shows the on-axis response, with the source directly in front. Speak off-axis and the mic sounds darker. Directional mics also have a proximity effect. As the Shure SM58 shows, working close can add 6 to 10 dB below 100 Hz, so a podcaster an inch from a dynamic mic will sound warmer than the chart suggests.
Learn more in our on-axis vs. off-axis mic placement and proximity effect guide.
Frequency Response vs. Frequency Range in Headphones
Headphones turn an electrical signal into sound. Their drivers are small speakers, so driver size and materials shape the curve. See our headphone driver types and driver size guide.
However, measurement rigs simulate a human head. That means a neutral won’t measure flat. That’s why reviewers compare a headphone frequency response curve to a target curve, not a straight line. Free tools like Squiglink let you overlay graphs of headphones you already know.
Why the Same Frequency Range Can Produce Different Sound
Two devices can share a 20 Hz–20 kHz rating and sound nothing alike:
- Different curves. One might be bass-heavy and the other bright across the exact same span.
- Different tolerances. As the Kali example shows, moving from ±3 dB to -10 dB can shift the low end by 6 Hz and the top end by 4 kHz.
- Different settings. The SM7B keeps one range but offers several responses through its switches.
- Different test setups. Every part of a signal chain has a frequency response. Measure a mic with a cheap speaker in an untreated room, and you capture the speaker and room too.
Frequency Response vs. Frequency Range: Which Is More Important?
Frequency response, in most cases. A good response graph already shows the range, plus everything the range leaves out.
What to Look for in a Microphone
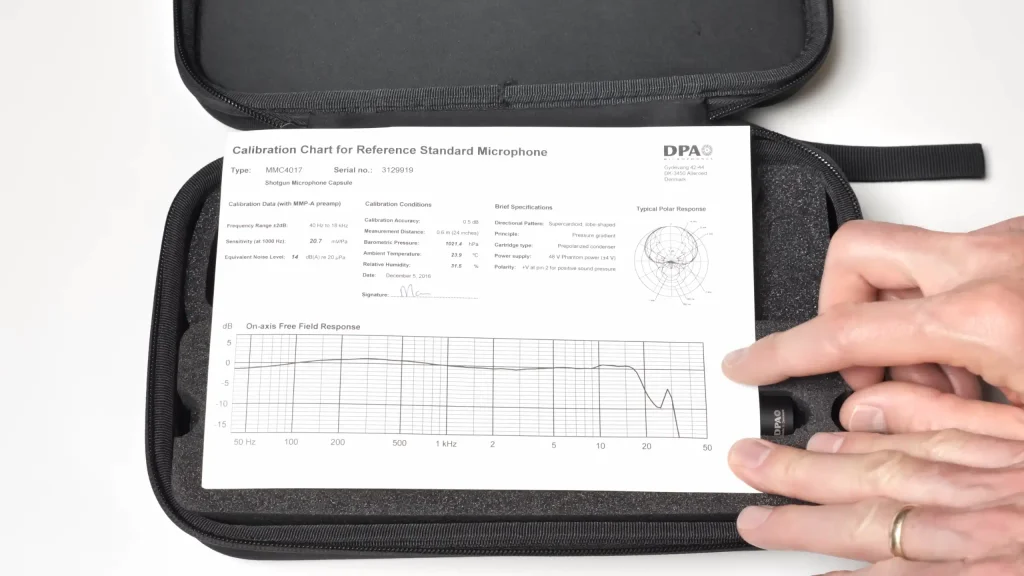
- A published chart. Look at the shape, not just the endpoints.
- A curve that matches your use. A gentle presence lift helps speech cut through. A flatter curve suits accurate recording.
- Proximity control. If you’ll work close, a built-in bass rolloff (fixed, like the SM58’s, or switchable, like the SM7B’s) keeps your voice from getting boomy.
- Other specs. Polar pattern, sensitivity and noise performance matter just as much.
What to Look for in Headphones
- A graph compared with a neutral target. Deviations show where it adds or removes energy.
- A signature that fits the job. For mixing, stay close to neutral. For music or gaming, personal preference is fair game.
- A shortlist, not a verdict. A frequency response graph works like a ZIP code: it narrows the search, but you still need to listen.
- EQ potential. Knowing the curve lets you EQ with purpose instead of guessing.
Check our guide on the microphone specifications and headphone specifications.
Final Words
Frequency range tells you how far a device reaches. Frequency response tells you what it does along the way. Range is the outline; response is the picture inside it.
When you compare microphones or headphones, don’t stop at “20 Hz–20 kHz.” Check the coverage, study the response curve, ask what tolerance the numbers use, and think about how you’ll use the device. Together, they tell you far more than any single spec.
FAQs
Is Frequency Response the Same as Frequency Range?
No. Frequency range is the span a device covers. Frequency response shows how its output level changes across that span.
Is 20 Hz–20 kHz the Standard Human Hearing Range?
It’s the standard estimate, not a hard rule. Some people hear slightly beyond it, and most people’s upper limit drops with age.
Does a Wider Frequency Range Mean Better Audio Quality?
Not necessarily. Range doesn’t show peaks, dips or overall balance, and without a tolerance you can’t tell how strong the response is at the extremes.
What Is a Good Frequency Response for Headphones?
One that suits your use. For mixing, look for a curve close to a neutral target. For casual listening or gaming, pick a signature you enjoy and fine-tune it with EQ.
What Is a Good Frequency Response for a Microphone?
It depends on what you record. For speech and vocals, 50 Hz–15 kHz or so is plenty, and a gentle presence boost helps your voice stand out. A flatter response captures sources more accurately.
